
Tempo
- By Canonical Observability
| Channel | Revision | Published | Runs on |
|---|---|---|---|
| latest/stable | 51 | 01 Aug 2024 | |
| latest/stable | 9 | 16 Feb 2024 | |
| latest/candidate | 71 | 01 Aug 2024 | |
| latest/candidate | 9 | 12 Dec 2023 | |
| latest/beta | 75 | 01 Aug 2024 | |
| latest/beta | 9 | 12 Dec 2023 | |
| latest/edge | 80 | 02 Sep 2024 | |
| latest/edge | 9 | 31 Jul 2023 |
juju deploy tempo-k8s
Deploy Kubernetes operators easily with Juju, the Universal Operator Lifecycle Manager. Need a Kubernetes cluster? Install MicroK8s to create a full CNCF-certified Kubernetes system in under 60 seconds.
Platform:
Tracing charm execution
When we talk about tracing in Juju, we usually refer to traces from the workload that a charm is operating. However, you can also instrument the charm code itself with distributed tracing telemetry.
Fetch the charm_tracing charm library
To start, grab the charm_tracing lib:
charmcraft fetch-lib charms.tempo_k8s.v1.charm_tracing
The charm_tracing lib contains all you need to add tracing telemetry collection to your charm code and send it to Tempo over an existing tracing integration.
This howto assumes that your charm already has an integration to tempo-k8s over the tracing relation interface. See integrating with tempo-k8s over tracing for instructions. The charm_tracing lib will use the same integration. This means that the same tempo instance that stores workload traces will also receive charm traces. In practice, you might want them to be separate Tempo instances. To achieve that, add a separate integration to your charm and point charm_tracing to that one instead.
This means that, if your charm is related to tempo-k8s charm and tempo-k8s is related to grafana-k8s over grafana-source, you will be able to inspect the execution flow of your charm in real time in Grafana’s Explore tab.
Quickstart: using the charm_tracing library
The main entry point to the charm_tracing library is the trace_charm decorator.
Assuming you already have an integration over tracing, and you’re already using lib.charms.tempo_k8s.v2.tracing.TracingEndpointRequirer, you will need to:
- import
lib.charms.tempo_k8s.v1.charm_tracing.trace_charm - decorate your charm class (if you have multiple, only decorate the ‘last one’ i.e. the one you pass to
ops.main.main()!) withtrace_charm. - pass to
trace_charmforward-references to:- the url of a tempo
otlp_httpreceiver endpoint - [optional] absolute path to a CA certificate on the
charmcontainer disk
- the url of a tempo
For example:
from lib.charms.tempo_k8s.v1.charm_tracing import trace_charm
from lib.charms.tempo_k8s.v2.tracing import charm_tracing_config

@trace_charm(tracing_endpoint="my_endpoint", cert_path="cert_path")
class MyCharm(...):
    # if your charm has an integration to a CA certificate provider, you can copy the CA certificate on the charm container and use it to encrypt charm traces sent to Tempo
    _cert_path = "/path/to/cert/on/charm/container/cacert.crt"

    def __init__(self, ...):
        # the tracing integration
        self.tracing = TracingEndpointRequirer(self, protocols=[
            ...,  # any protocols used by the workload
            "otlp_http"  # protocol used by charm tracing
        ])

        # this data will be picked up by the decorator and used to determine where to send traces to, and what CA cert (if any) to use to encrypt them if the endpoint is https.
        self.my_endpoint, self.cert_path = charm_tracing_config(
            self.tracing, self._cert_path)
At this point your charm MyCharm is automatically instrumented so that:
- Every charm execution starts a “charm exec” root span, containing as children sub-spans:
- the
juju eventthat the charm is currently processing. - every
ops eventemitted by the framework on the charm, including deferred events, custom events, etc…
- the
- In turn, every event emission span contains as children:
- every
charmmethod call (except dunders) as aspan.
- every
What you obtain is, for each event the charm processes, a trace of the events emitted on the charm and the cascade of method calls they trigger as they are handled.
See more about the analogy between charm execution and traces in traces in the charm realm.
Autoinstrumentation beyond the charm class
The decorator will by default create spans only for your top-level charm type method calls. However, you can also autoinstrument other types such as objects you are importing from charm libs or other modules, relation endpoint wrappers, workload abstractions, and even individual functions.
from charms.tempo_k8s.v1.charm_tracing import trace_type, trace_method, trace_function


# any method call on Foo will be traced
@trace_type
class Foo:
    ...


class Bar:
    # only trace this method on Bar
    @trace_method
    def do_something(self):
        pass


# trace this specific function
@trace_function
def do_something(...):
    pass
Dynamically autoinstrumenting other types
You can tell trace_charm to automatically decorate other types (so you don’t have to manually decorate them with @trace_type) by using the extra_types parameter:
from charms.tempo_k8s.v1.charm_tracing import trace_charm
from charms.prometheus_k8s.v0.prometheus_scrape import MetricsEndpointProvider

@trace_charm(
    tracing_endpoint="my_tracing_endpoint",
    extra_types=[
        MetricsEndpointProvider,  # also trace method calls on instances of this type
    ],
)
class FooCharm(CharmBase):
    ...
adding classes to extra_types will instruct the decorator to automatically open spans for each (public) method calls on instances of those types.
Customizing spans
In order to get a reference to the parent span at any point in your charm code, you can use the charms.tempo_k8s.v1.charm_tracing.get_current_span function.
from charms.tempo_k8s.v1.charm_tracing import trace_charm, get_current_span


@trace_charm(...)
class FooCharm(CharmBase):
    ...

    def _do_something(self):
        span = get_current_span()
        # Mind that Span will be None if there is no (active) tracing integration
Note that you can do the same from any point in the charm code, not just methods on the charm class. get_current_span will determine based on the context whether there is a parent span, and return None otherwise. So long as the charm instance is alive (and fully initialized!) somewhere in memory, you can grab the current span and manipulate it.
For more documentation on all you can do with the span, refer to the official otlp Python sdk docs.
For example, once you have a reference to the current span, you can attach events to it:
span = get_current_span()
span.add_event(
    "something_happened",
    attributes = {
        "foo": "bar",
        "baz": "qux",
    },
)
or tag it as ‘failed’:
from opentelemetry.trace.status import StatusCode
span = get_current_span()
span.set_status(StatusCode.ERROR, "this operation has failed")
Creating custom spans
charm_tracing autoinstruments only traces at the level of charm method calls. If you want more granularity (open a span for each iteration in a complex for loop, for example), you can use the otlp python sdk directly to manually create spans and attach them to the tracer configured by the trace_charm decorator. For example:
from opentelemetry import trace

def some_function_or_method():
    # Create a tracer from the tracer provider set up by the trace_charm decorator. Make sure this is called AFTER the charm instance has been initialized.
    tracer = trace.get_tracer("my.tracer.name")

    with tracer.start_as_current_span("span-name") as span:
        print("do work")  # this will be tracked by the span

        # you can nest them too
        with tracer.start_as_current_span("child-span-name") as child_span:
            print("do more work")
Customizing the service name
By default, charm traces will be associated with the name of the Juju application as their service name. You can override that by passing a service_name argument to trace_charm like so:
@trace_charm(
    tracing_endpoint="my_tracing_endpoint",
    service_name="my-service",  # default would be the Juju application name the charm is deployed as
)
class FooCharm(CharmBase):
    ...
Viewing the traces in Grafana
Open the Grafana Explore tab in a browser (see here for more detailed instructions).
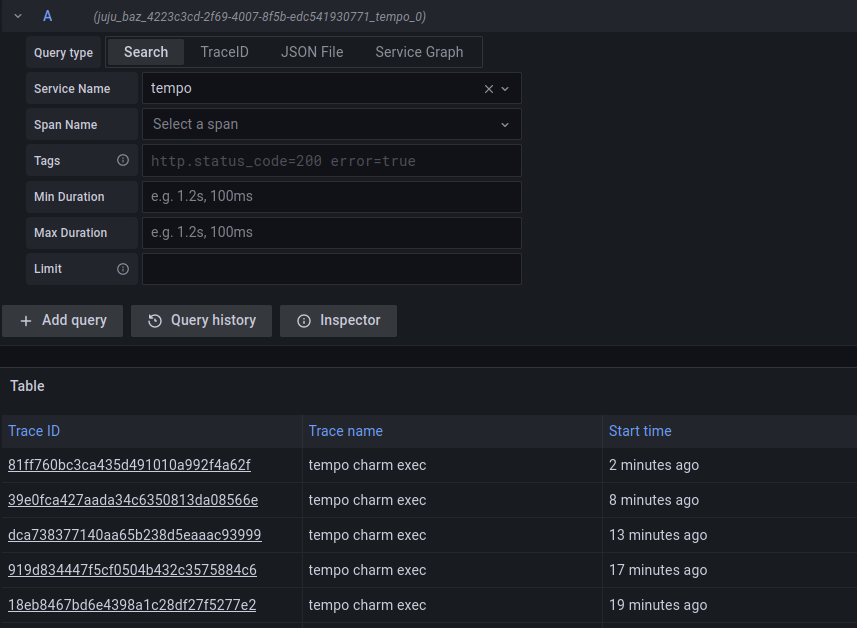
Next, navigate to the traces for your charm:
- go to
Exploreand select the Tempo datasource. - pick the
service_nameyou gave to MyCharm (the default is the application name) to see the traces for that charm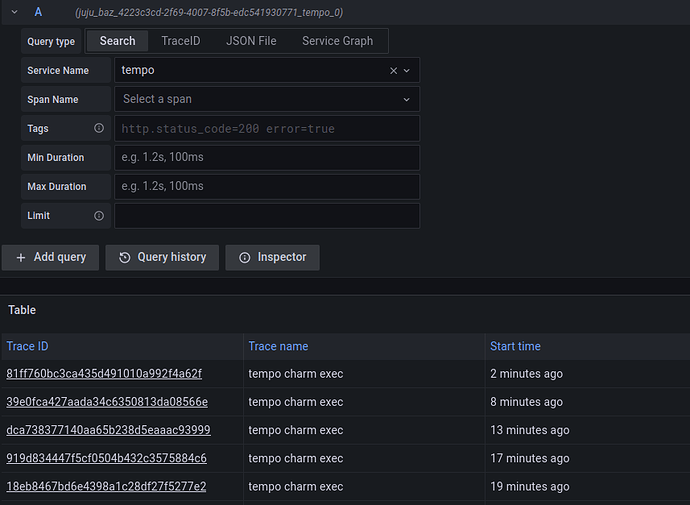
- click on a trace ID to visualize it. For example, this is the trace for an
update-statusevent on the Tempo charm itself: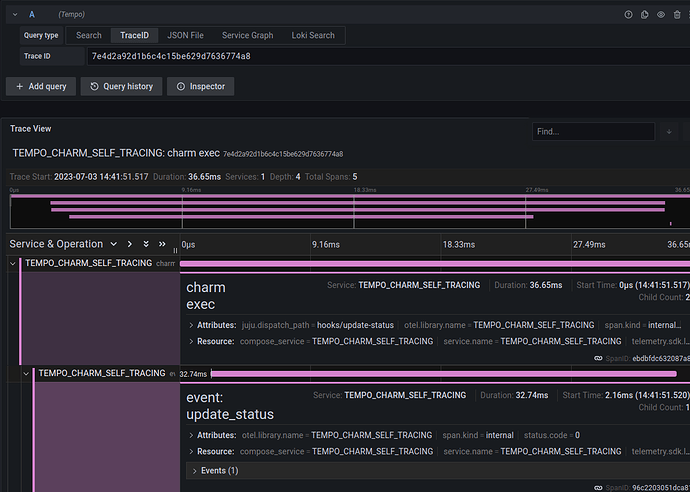

Mapping events to traces with jhack tail
jhack tail supports a -t option to show the trace IDs associated with a charm execution:
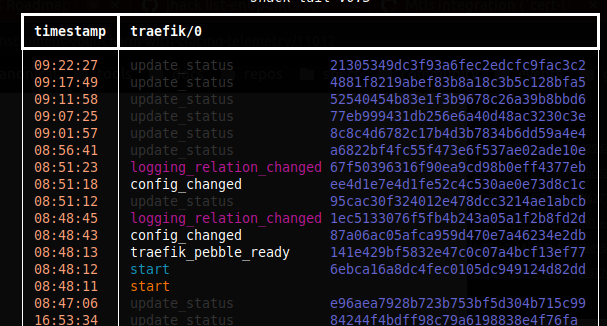
This means that you can tail a charm, grab the trace id from tail, put it in the grafana dashboard query and get to the trace in no time.
Contributors: @ppasotti, @michaeldmitry